
Introduction
Dynamic reverse engineering and binary debugging involve analyzing the behavior of a running program to understand its functionality and/or identify potential vulnerabilities. This technique is often used for malware analysis, security research, and software testing. If you ever had the chance to dynamically reverse engineer, you most likely used GDB as the debugger. But ever since 2007, Apple shifted gradually from GCC to Clang, with it becoming the default compiler in Xcode 4.0 released in 2011.
This means we will need to use lldb for debugging. Fortunately, the differences in user experience aren’t big.
lldb Setup
Installing lldb could have not been easier, simply open the terminal and write lldb, if it’s not installed you will be prompted with the installation window.
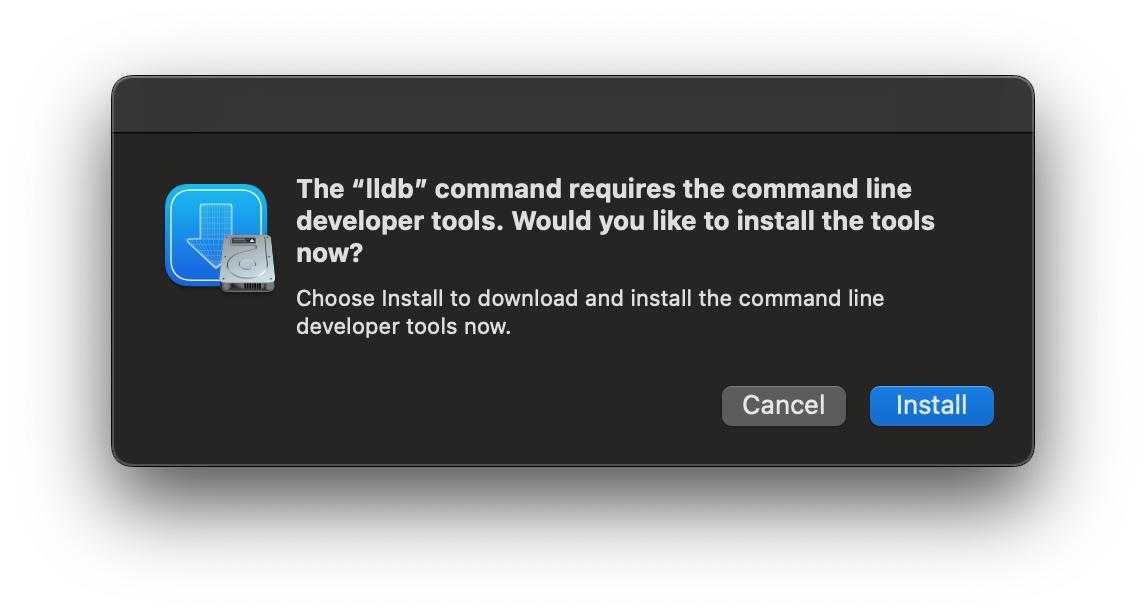
After installation, if we try to run lldb and attach it to a running process (or execute a binary via process launch) we will probably face with the following error:
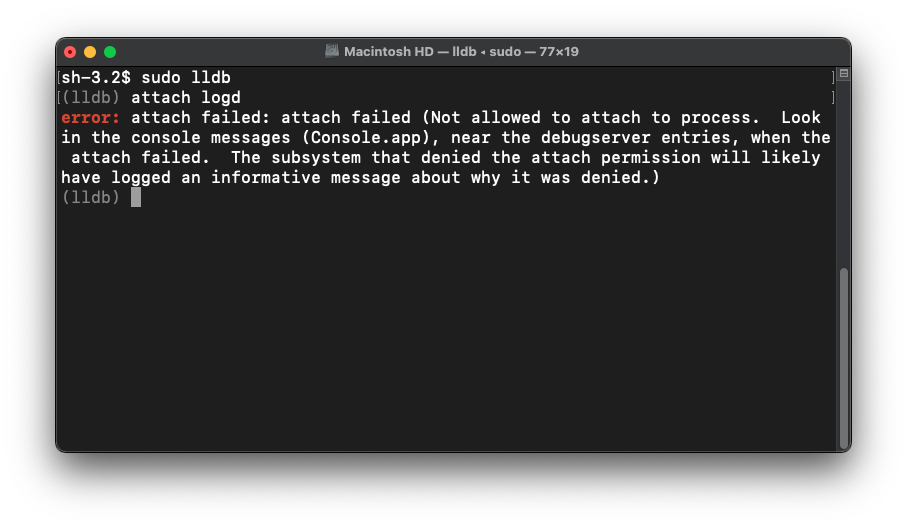
error: attach failed: attach failed (Not allowed to attach to process. Look in the console messages (Console.app), near the debugserver entries, when the attach failed. The subsystem that denied the attach permission will likely have logged an informative message about why it was denied.)
OSX Protections
Debugging applications on macOS can be more complex than on other operating systems due to the stringent security measures implemented by Apple. Mechanisms such as Harden Runtime, System Integrity Protection (SIP), and Gatekeeper, are designed to safeguard user privacy and system integrity but often restrict necessary access for researchers.
One important tip that can help us troubleshoot issues throughout our setup process is the use of the console app. It provides a centralized interface to view system logs, application logs, and other diagnostic information. By analyzing these logs, we can pinpoint which mechanism blocks us and seek a relevant solution.
So let’s try to attach via lldb again and take a look at the console.
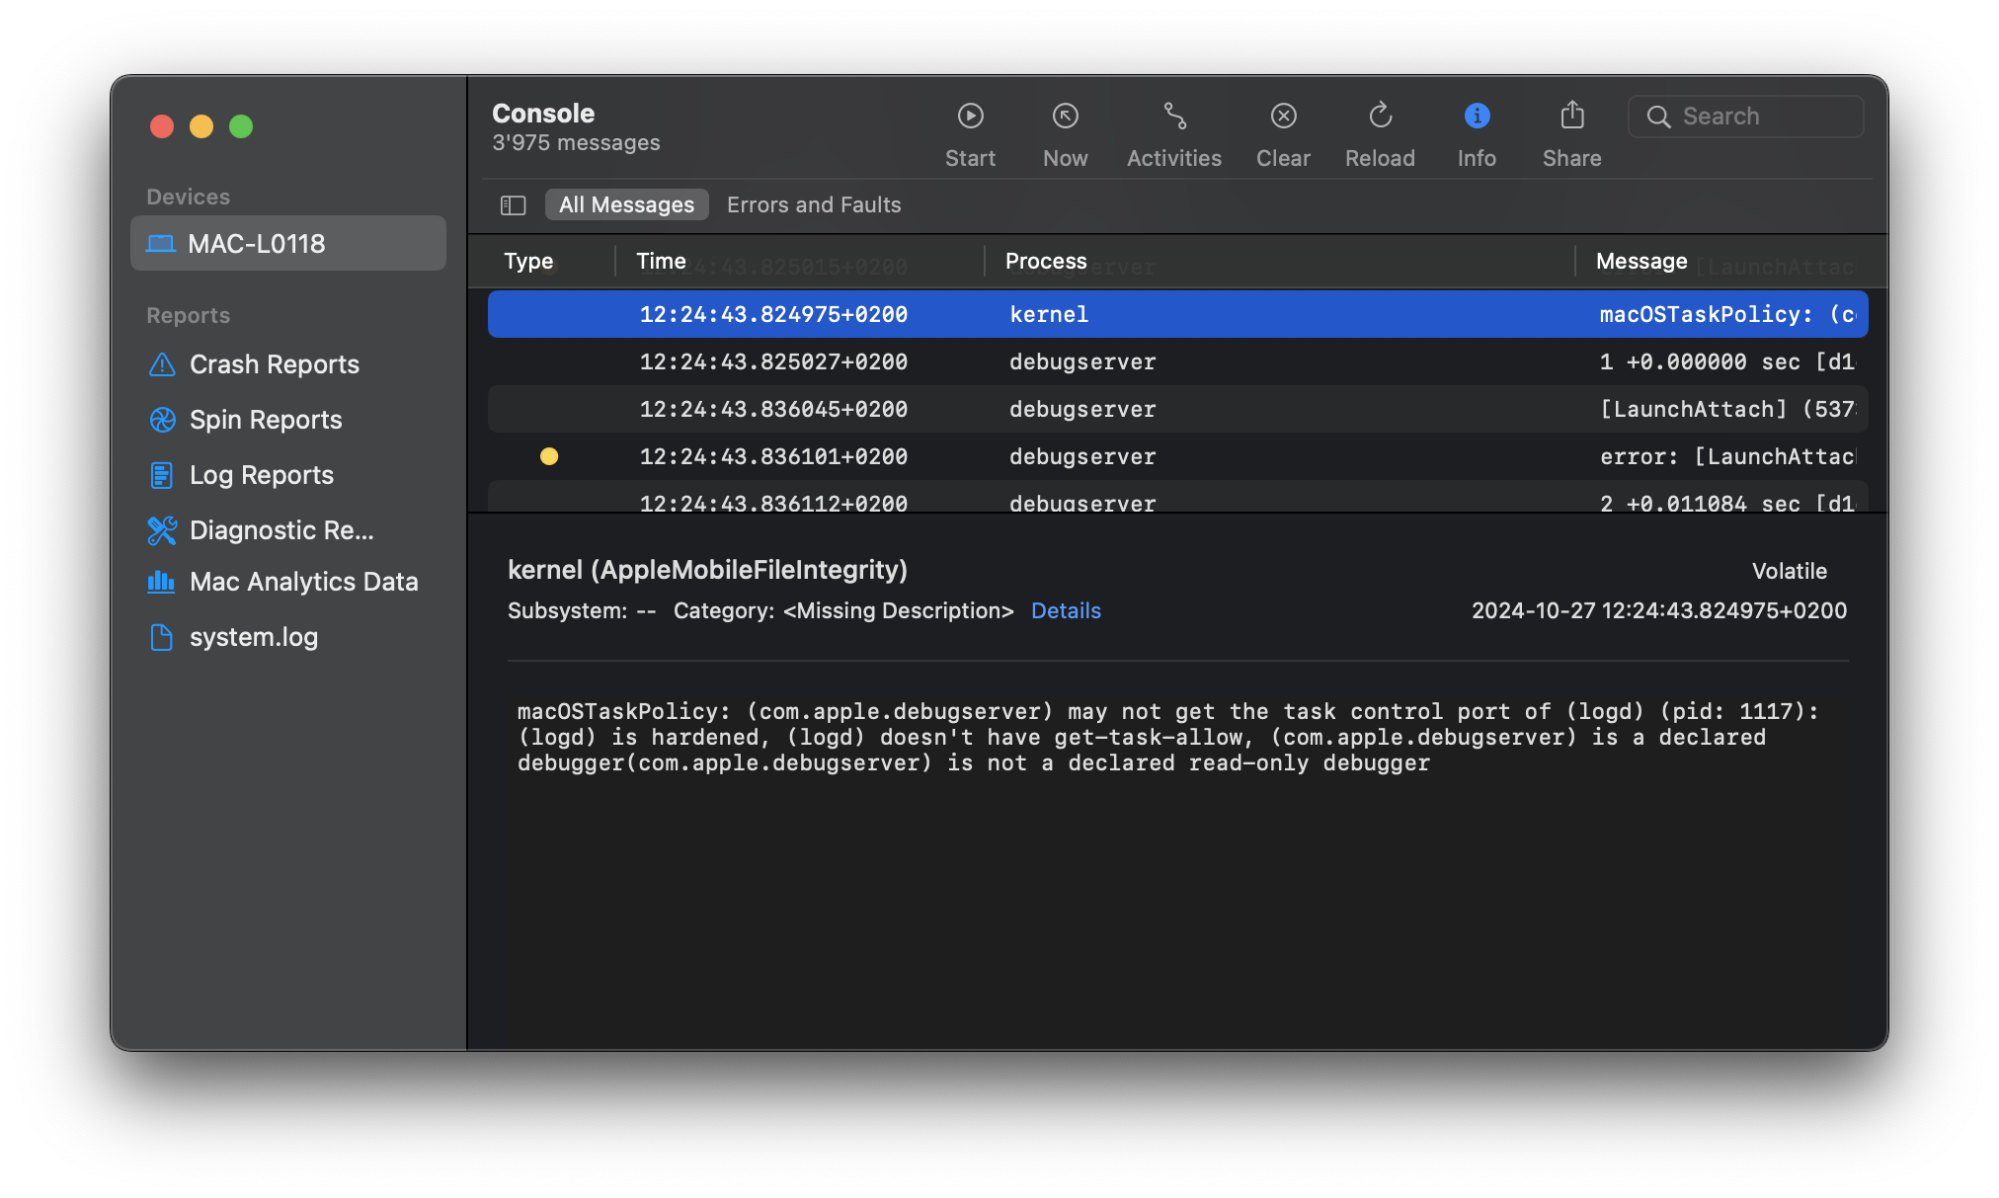
Due to Harden Runtime, an application in MacOS has to grant permissions in order for debuggers to attach to their processes. These permissions are done via entitlement in the code signature. In our specific case, get-task-allow entitlement is missing.
But as researchers, we usually debug built applications that are already signed with certain permissions. Can we change them?
Self-Signing Binaries to Grant Permissions
We can resign, with extra permissions, the specific binary we would like to debug. However, as I will explain later in the blog, it might cause some other problems in the future. But, for now, let’s see how we can resign executables.
First, here is how we can see a file’s current signature: Form the Authority, TeamIdentifier, to the actual (XML formatted) entitlements.
1 | codesign -d -vvv --entitlements :- <path_to_file> |
We can take the XML text of the entitlements and write it to a file adding our get-task-allow permission, e.g:
1 |
|
Now we need to create a certificate, which we can use to sign the file.
- Open Keychain Access application

- And via the toolbar create a certificate with the type “Code Signing”:
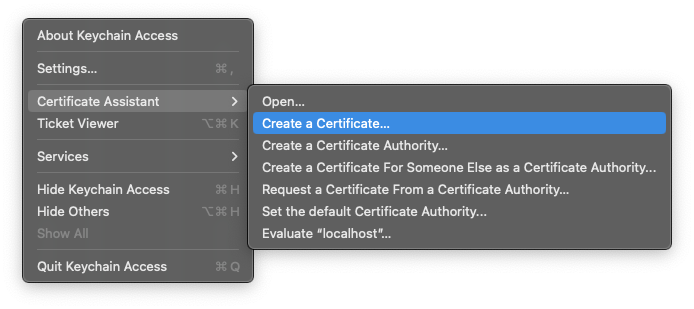

using the custom certificate we can now re-sign the executable using:
1 | sudo codesign --entitlements <path_to_entitlements.xml> -fs lldb <path_to_binary> |
lldb is the name given to the certificate in this example, of course, this can be whatever you’d like. And the -fs flag, forcefully signs the binary which ignores previous signatures.
To test if the signature was updated, simply run the first command discussed in this section. You should see the new entitlements (and the custom certificate as the authority).
Bypassing Signature Check
Sometimes, changing the signature can affect the binary’s execution flow if the implemented logic checks certain fields of the signature that have been tampered with. A common check is the Team Identifier, which is meant to identify the team that developed the application (This can be used for example, when an application needs to verify that a received XPC communication is made from a trustable source).
Insufficient Signature Check
If not performed correctly, such as in this case covered by Wojciech Reguła, you can simply change the “Organizational Unit” in the certificate by overriding the default parameters of the certificate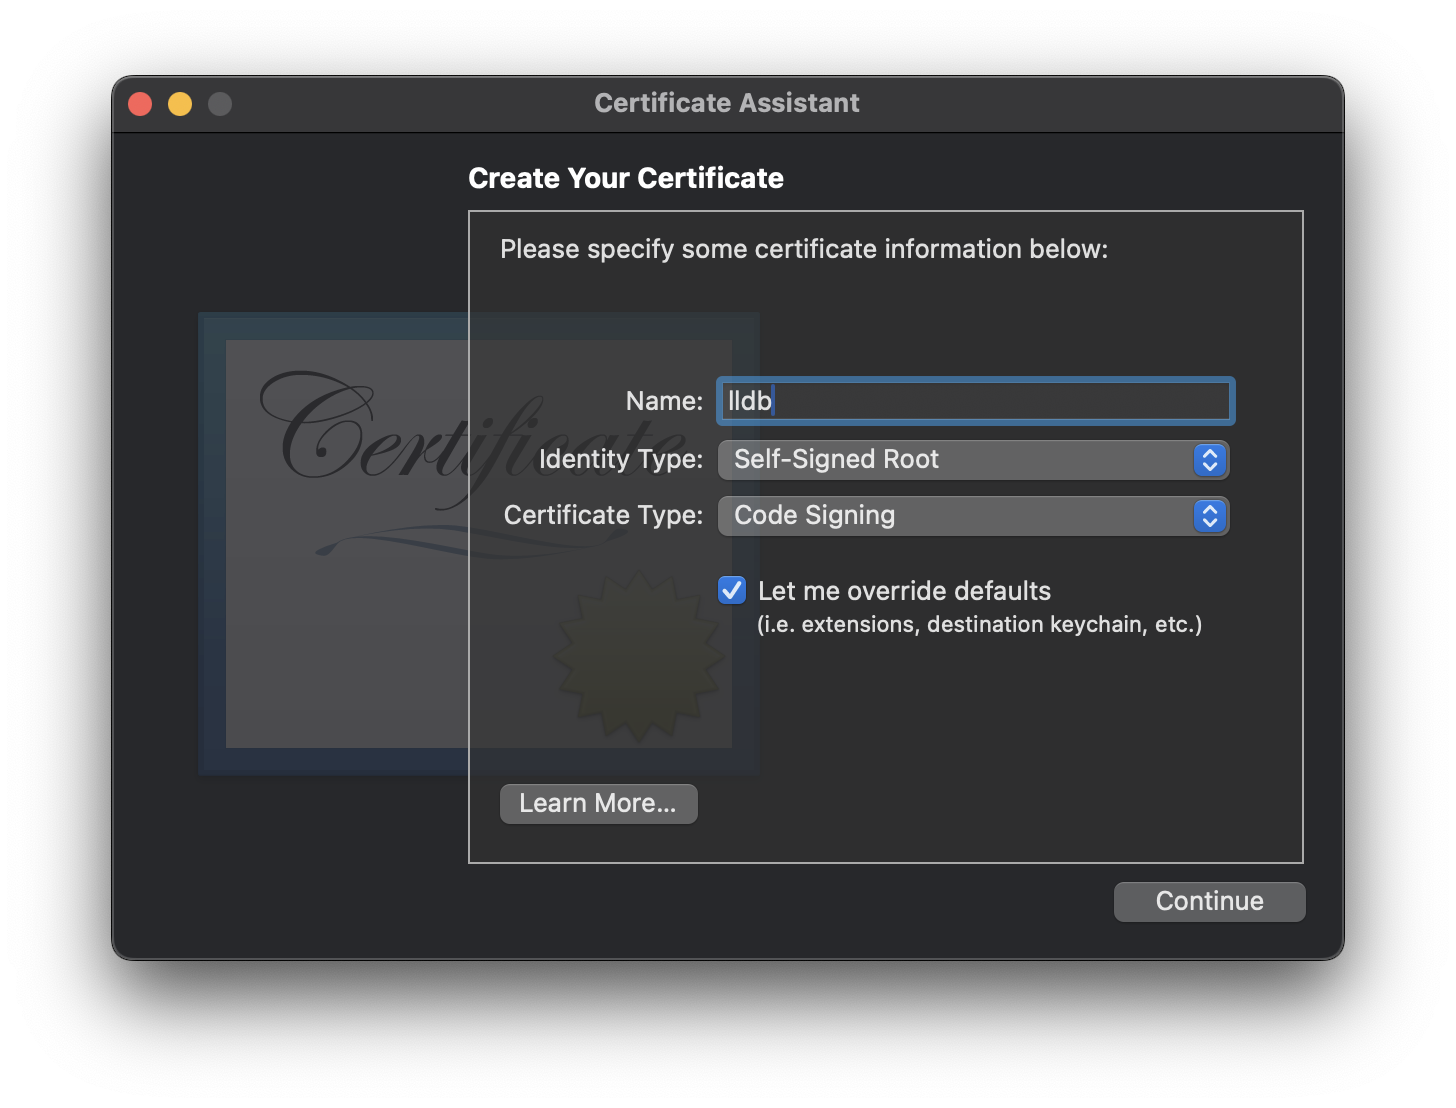
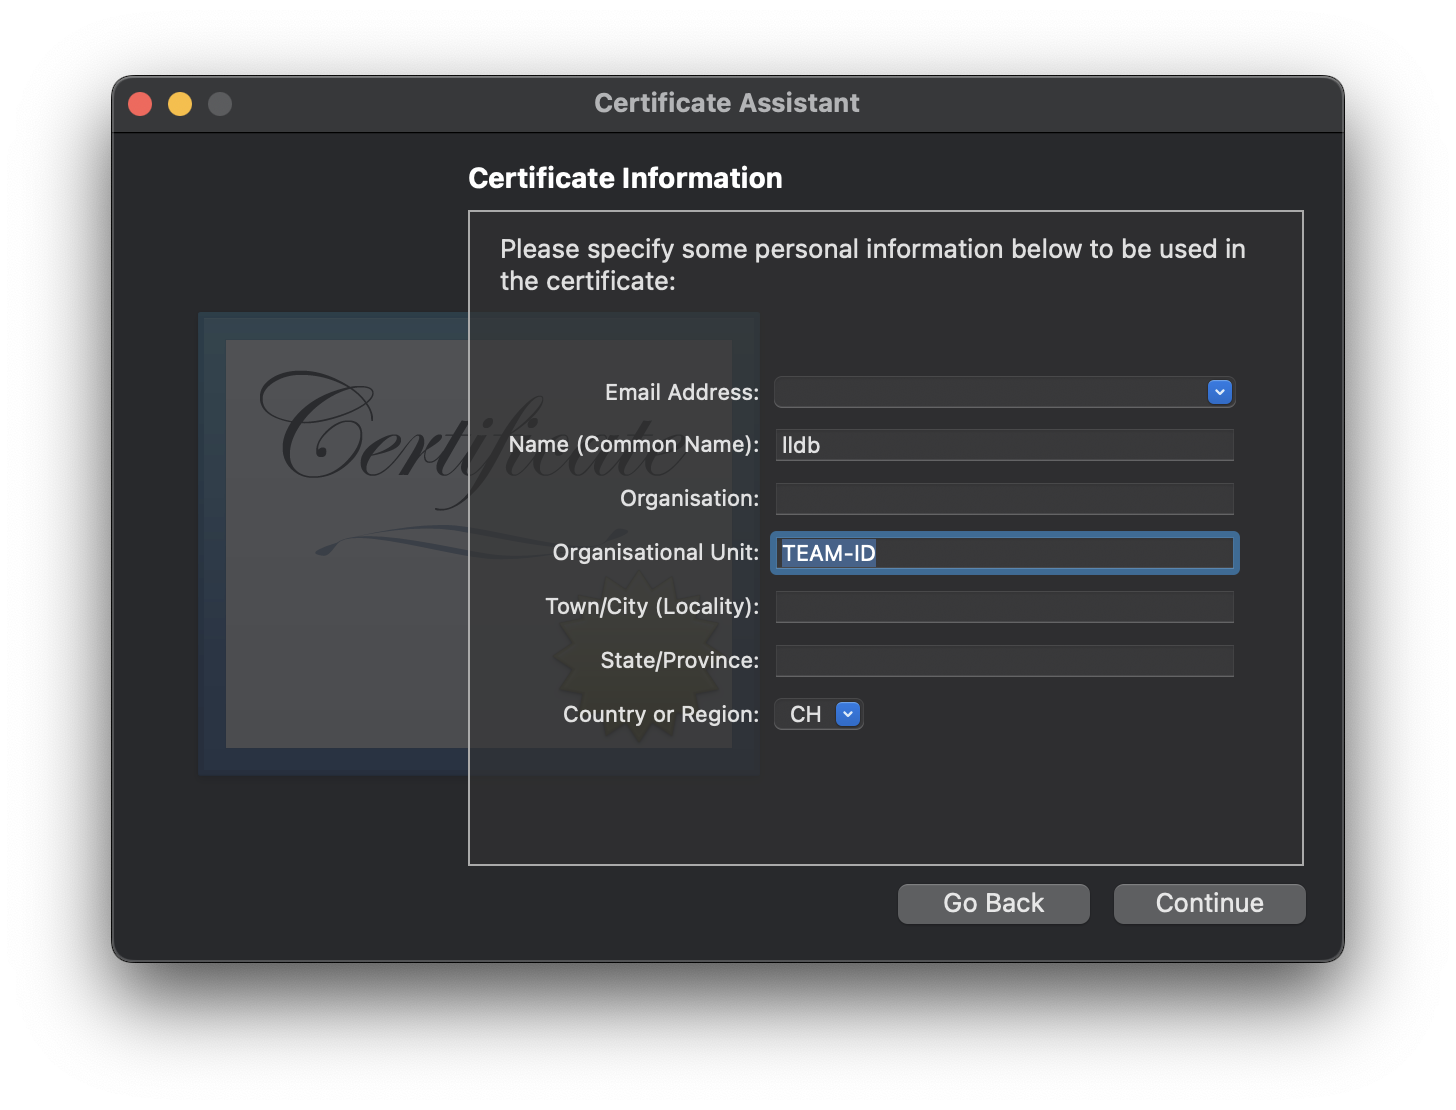
However, in one of my research, the application used the key kSecCodeInfoTeamIdentifier, which checked the team identifier in a safe manner, and I couldn’t find a way to change it. In this case I had to seek different solutions, with the simplest ones being patching the binary to bypass the verifications.
We can automate a dynamic patch to the memory or change the file on the disk itself, which will avoid the check of the signature. Each patching approach, dynamic vs. static, has pros and cons. In the dynamic approach, we change the code in memory after the binary is already loaded, and depending on the situation, it could be simpler than a static patch as this method does not require us to resign the binary again.
Dynamic Patching
For demonstration purposes, let’s say we would like to patch a function named is_dev, that hard-codedly returns 0. But in cases when it returns 1, the signature verification is skipped (finding what exactly is needed to be changed is binary-dependent, and can be discovered by static reverse engineering).
The function disassembled code looks as such:
1 | 00 00 80 52 mov w0,#0x0 |
We can use an online disassembler or change the value directly in ghidra to see the new function bytes, in this case, returning 1 will change the first null byte to \x20. Let’s look at two approaches to patching the function:
Using lldb CLI:
- Attach to the process
- Find the function location in memory using
image lookup -n is_dev -v - Write to change the code using
mem write <address> <value> - Read to confirm the change -
mem read <address> (--count optional)
Automate it using Python (official docs):
- Access scripting tool via the
scriptcommand inlldb‘s CLI - Or if you’d like to import
lldbdirectly into your Python environment- Locate
lldbpython module usinglldb -P, then according to the module use the corresponding python version (can see it in the file name_lldb.cpython-{version}-darwin.so, for example_lldb.cpython-312-darwin.souse python3.12) - In case you get
ImportError: cannot import name '_lldb' from partially initialized module 'lldb' (most likely due to a circular importor would like another version you canbrew install llvmand get the new python module at/opt/homebrew/opt/llvm/bin/lldb -P
- Locate
- Here is a sample code:
1
2
3
4
5
6
7
8
9
10
11
12
13
14
15
16import sys sys.path.append('/Applications/Xcode.app/Contents/SharedFrameworks/LLDB.framework/Resources/Python3')
import lldb
process_name = "<NAME>"
listener = lldb.SBListener()
error = lldb.SBError()
dbg = lldb.SBDebugger.Create()
target = dbg.CreateTarget(None)
process = target.AttachToProcessWithName(listener, process_name, False, error)
function_name = "is_dev"
function = target.FindFunctions(function_name)[0]
function_address = function.GetSymbol().GetStartAddress()
process.WriteMemory(function_address.GetLoadAddress(target), '\x20', error)
# check that it worked - process.ReadMemory(function_address.GetLoadAddress(target)-1, 1, error)
process.Continue()
Static Patching
Static patching can be the solution in some scenarios where the binary that you need to patch runs on demand and does not stay running. This is a simpler solution, but can run into problems since we do need to re-sign the executable.
You can directly patch the binary via ghidra, just change the desired code and file -> export program. After that, you’ll need to sign the file again as explained in previous sections. Again, if something doesn’t work, the console app is your friend.
Summary
In this blog, I covered a beginner-friendly explanation on setting up the environment for dynamically debugging a complied application on MacOS. I discussed how to overcome some of Apple’s protections and provided simple tools to self-diagnose issues that will likely arise. Hopefully this will help you start smoothly when debugging binaries on MacOS.